The other day I came across a post about this dataset on my LinkedIn feed which was essentially an open survey asking people what industry they work in, their age, their salary, their location, and their experience level. More so than just the data itself, I thought the whole thing was interesting because it was a live survey, feeding into this google sheet, with pretty digestible information right off the bat.
And because it was so digestible, it lends itself well to prompt some questions in your head right away… things like:
- In what industries are most people my age working?
- What’s the average salary by industry and/or age group?
- Are certain industries more popular in certain cities, and if so which?
- Which industries have the highest composition of young people… older people?
- Does experience level tie to salary in some industries more than others
And on and on! Some of these questions were a bit easier to answer right away and others… well maybe I’ll come back to it. Some things to keep in mind about the dataset – only those answered in US dollars were used, some job titles were grouped together – ie “software” was grouped into “technology”, and this dataset is unweighted and not at all normalized to the population, so while interpreting the results we should say to ourselves “This dataset tells us…” and be wary of extrapolating the results as an end all be all fact!
Ok let’s jump into it!
Which Industries are Most Popular Among Each Age Group?
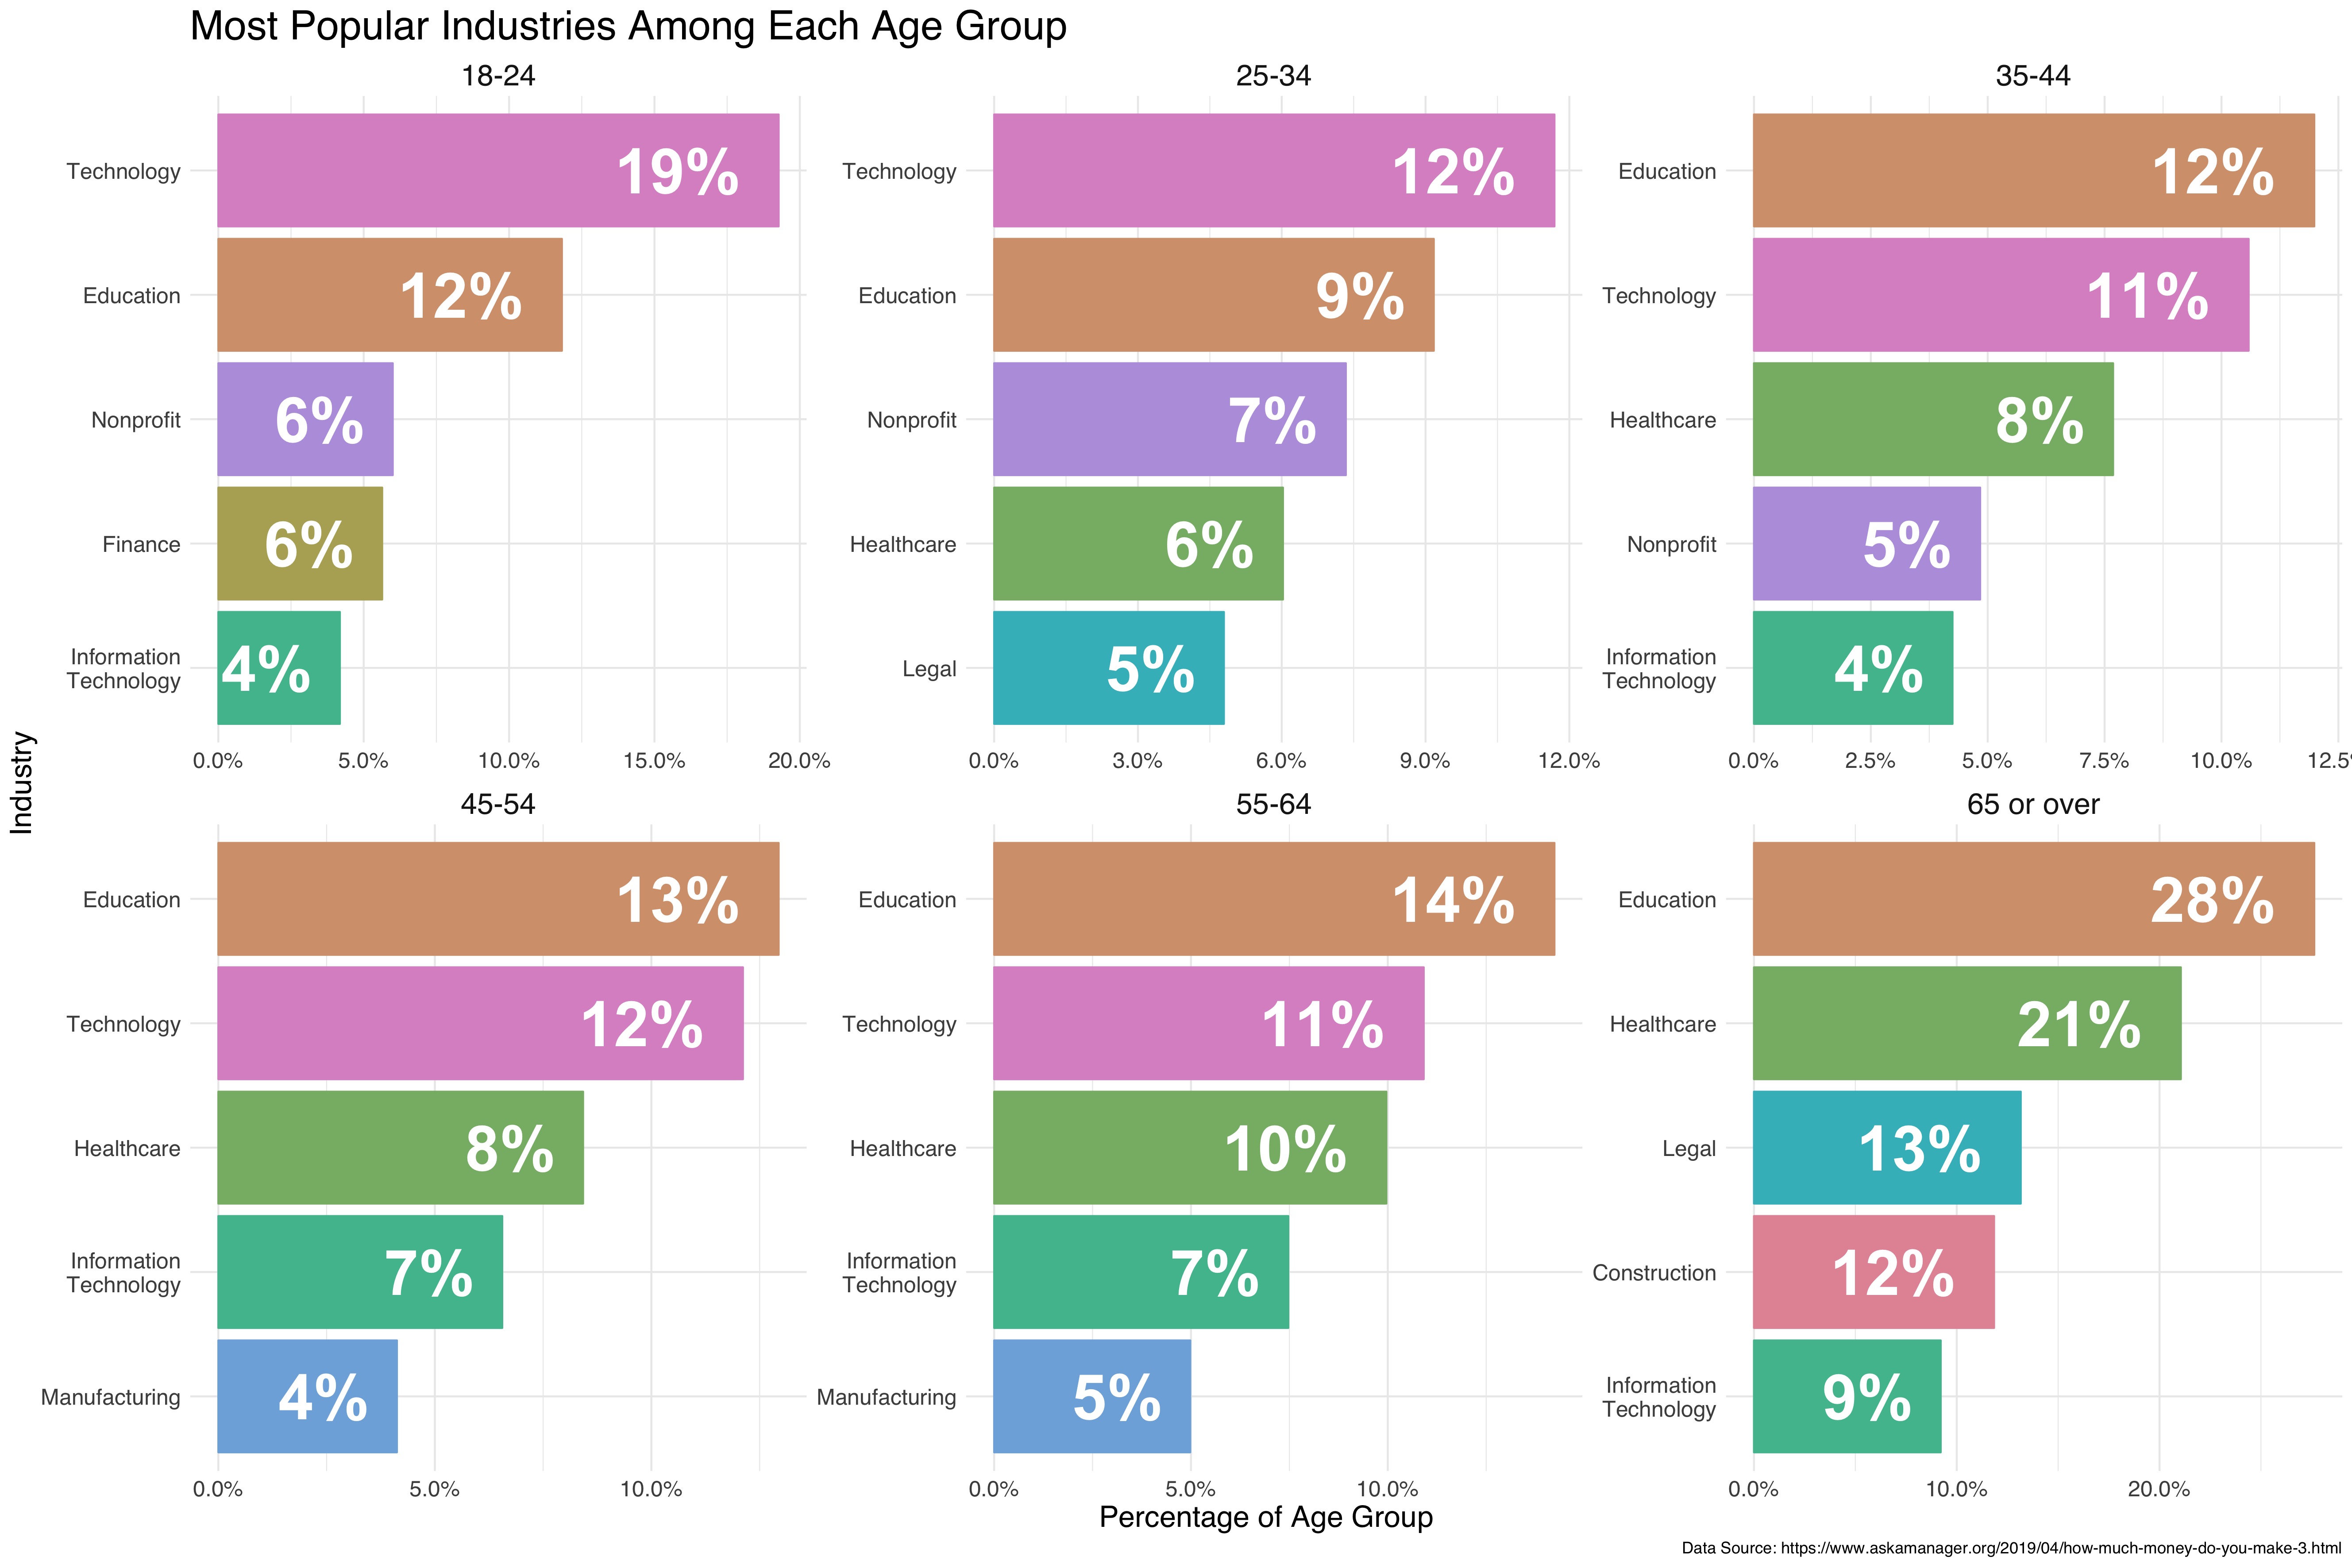
I thought this was super interesting. A few things that stand out to me:
- Education remains in the top 2 among all ages – at the number one most common industry among folks 35+.
- Technology is the top industry among younger folks (under 35), but still remains in the top 2 among those between 35 and 64.
- Finance only shows up as the top industry among workers between the ages of 18 and 34.
- Healthcare slowly climbs from not being in the top 5 industry for those 18-24, 4th most common for those 25-34, 3rd for those 35-64, and second most common for those 65+.
What is the average salary by age group?
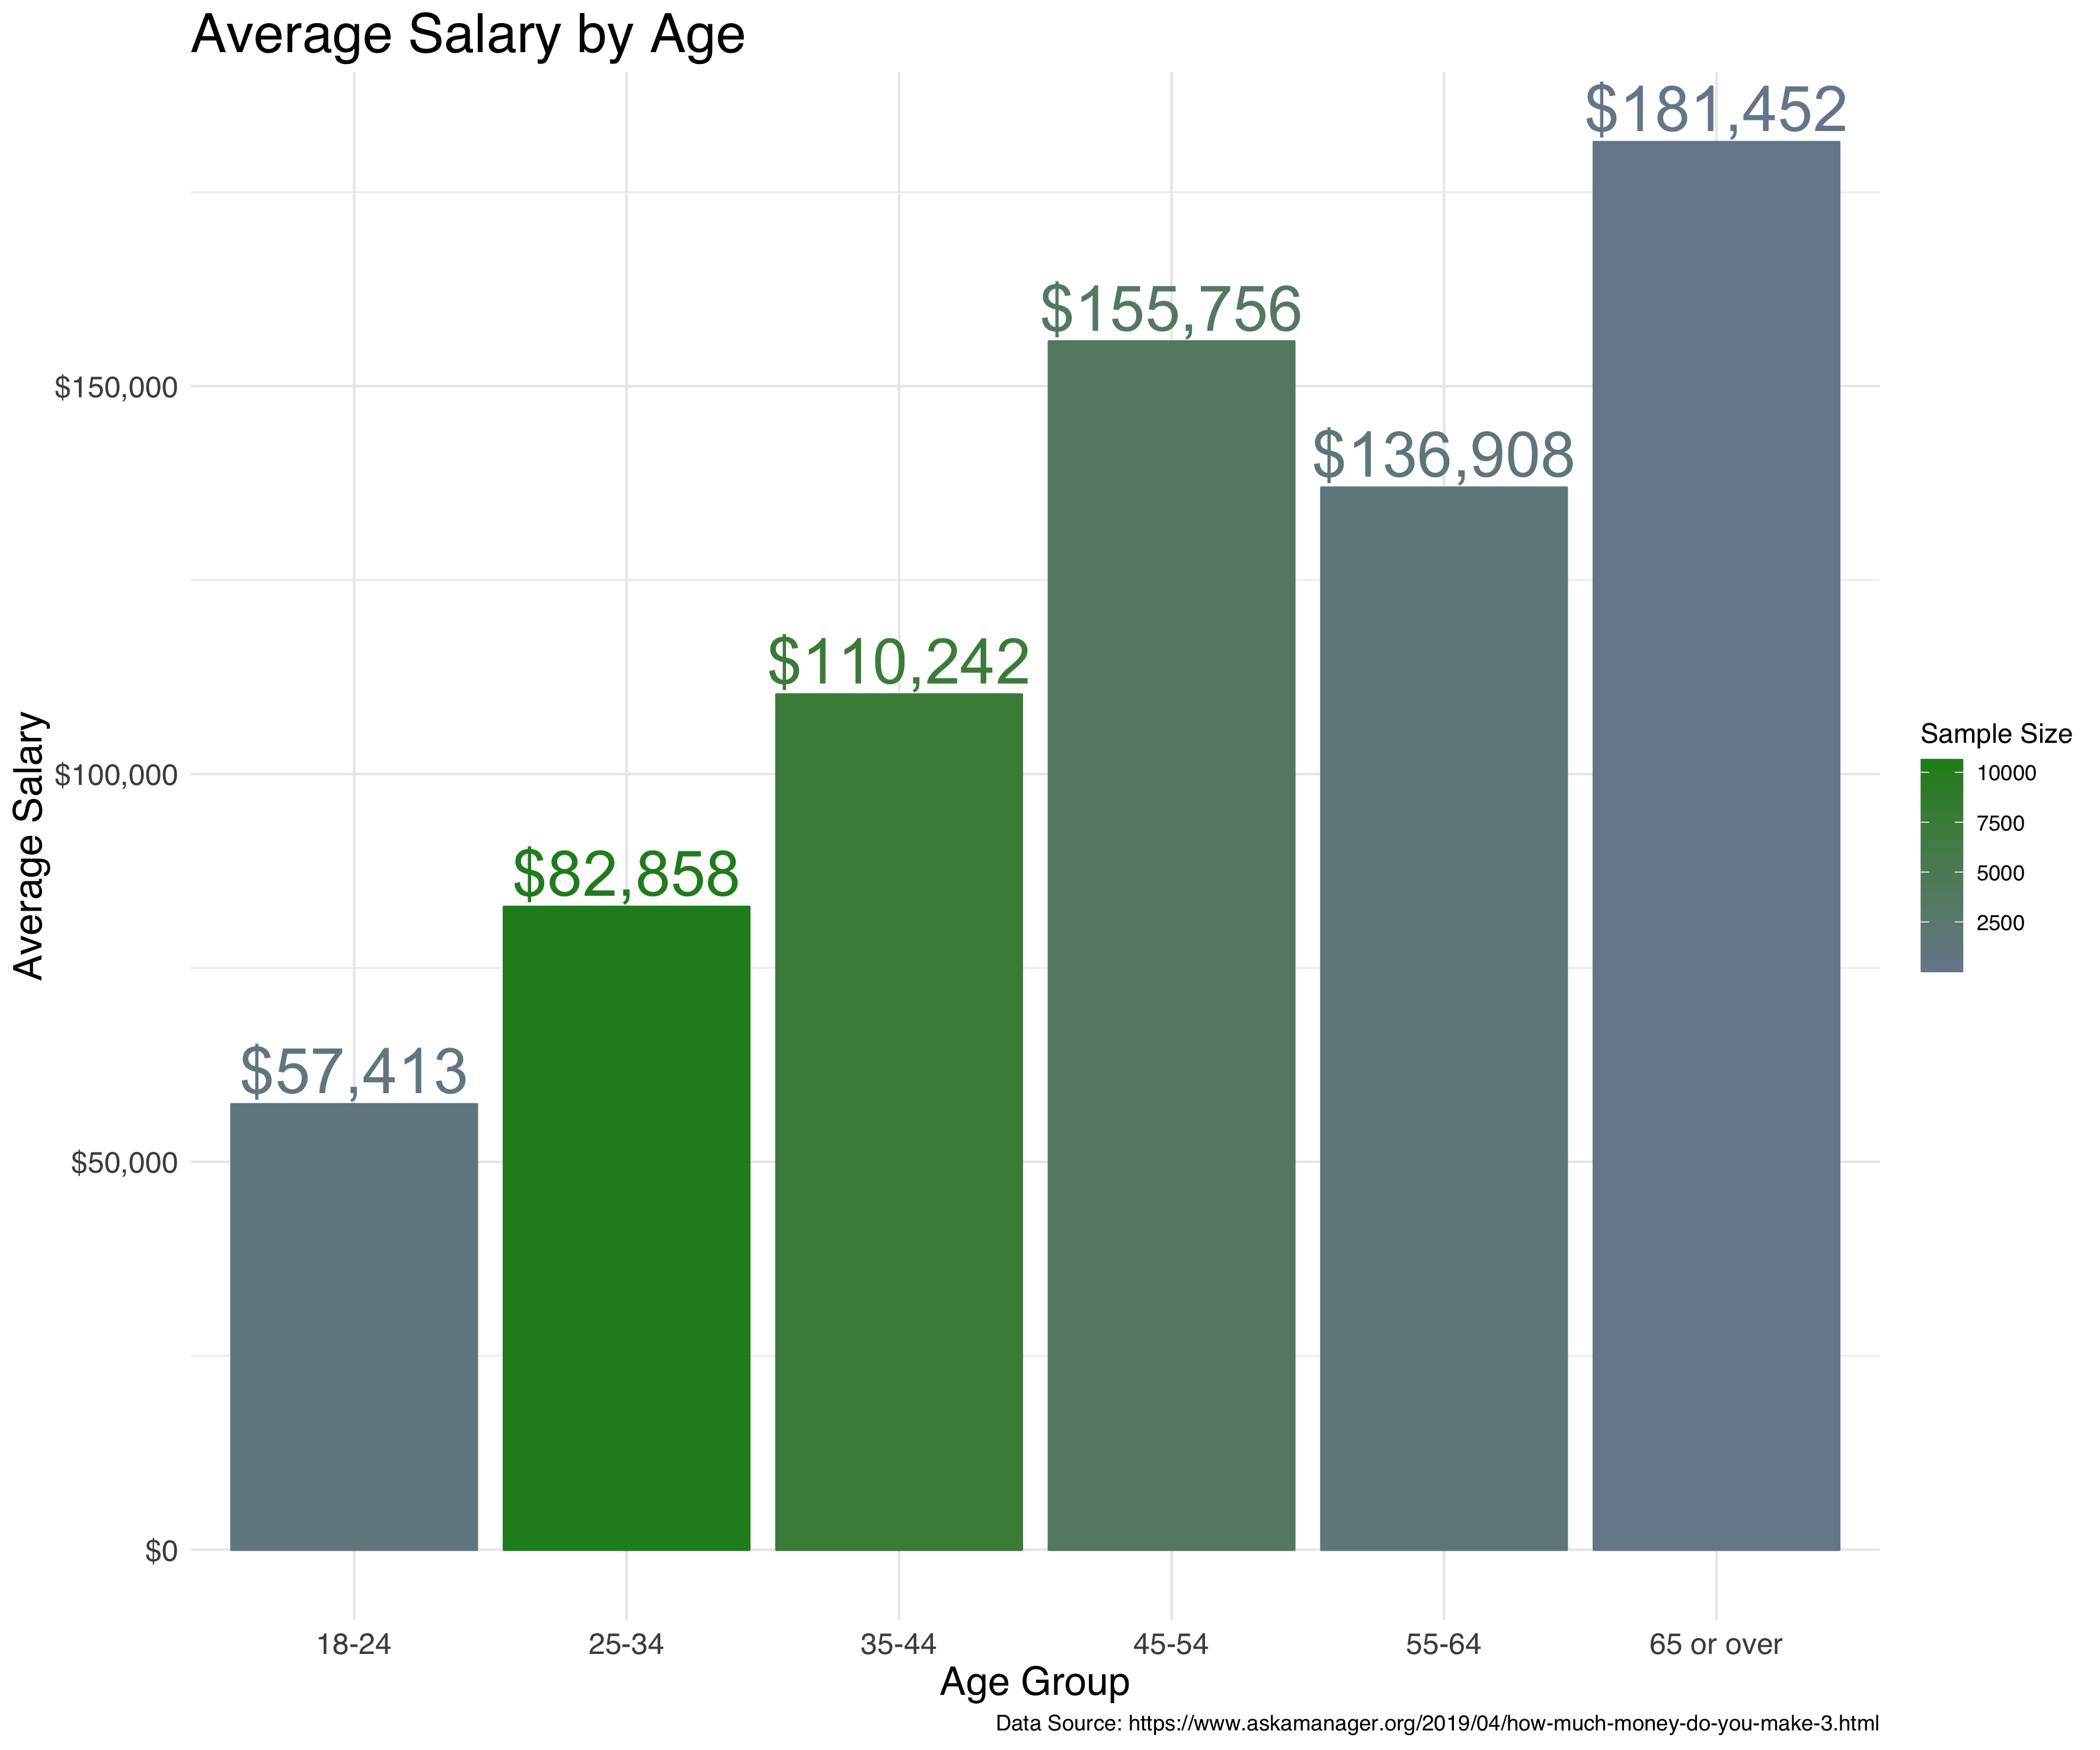
I’d say this pretty much checks out. Goes with my assumption that as you get older, experience increases and thus salary increases. It’s important to keep sample size in mind here. The largest sample size is among those 25-34, so we can count on that being most accurate, while the others less so. It’s also interesting to see that this data set tells us that the highest jump in salaries occurs between age groups 35-44 and 45-54.
Which Industries Have The Highest Salaries?
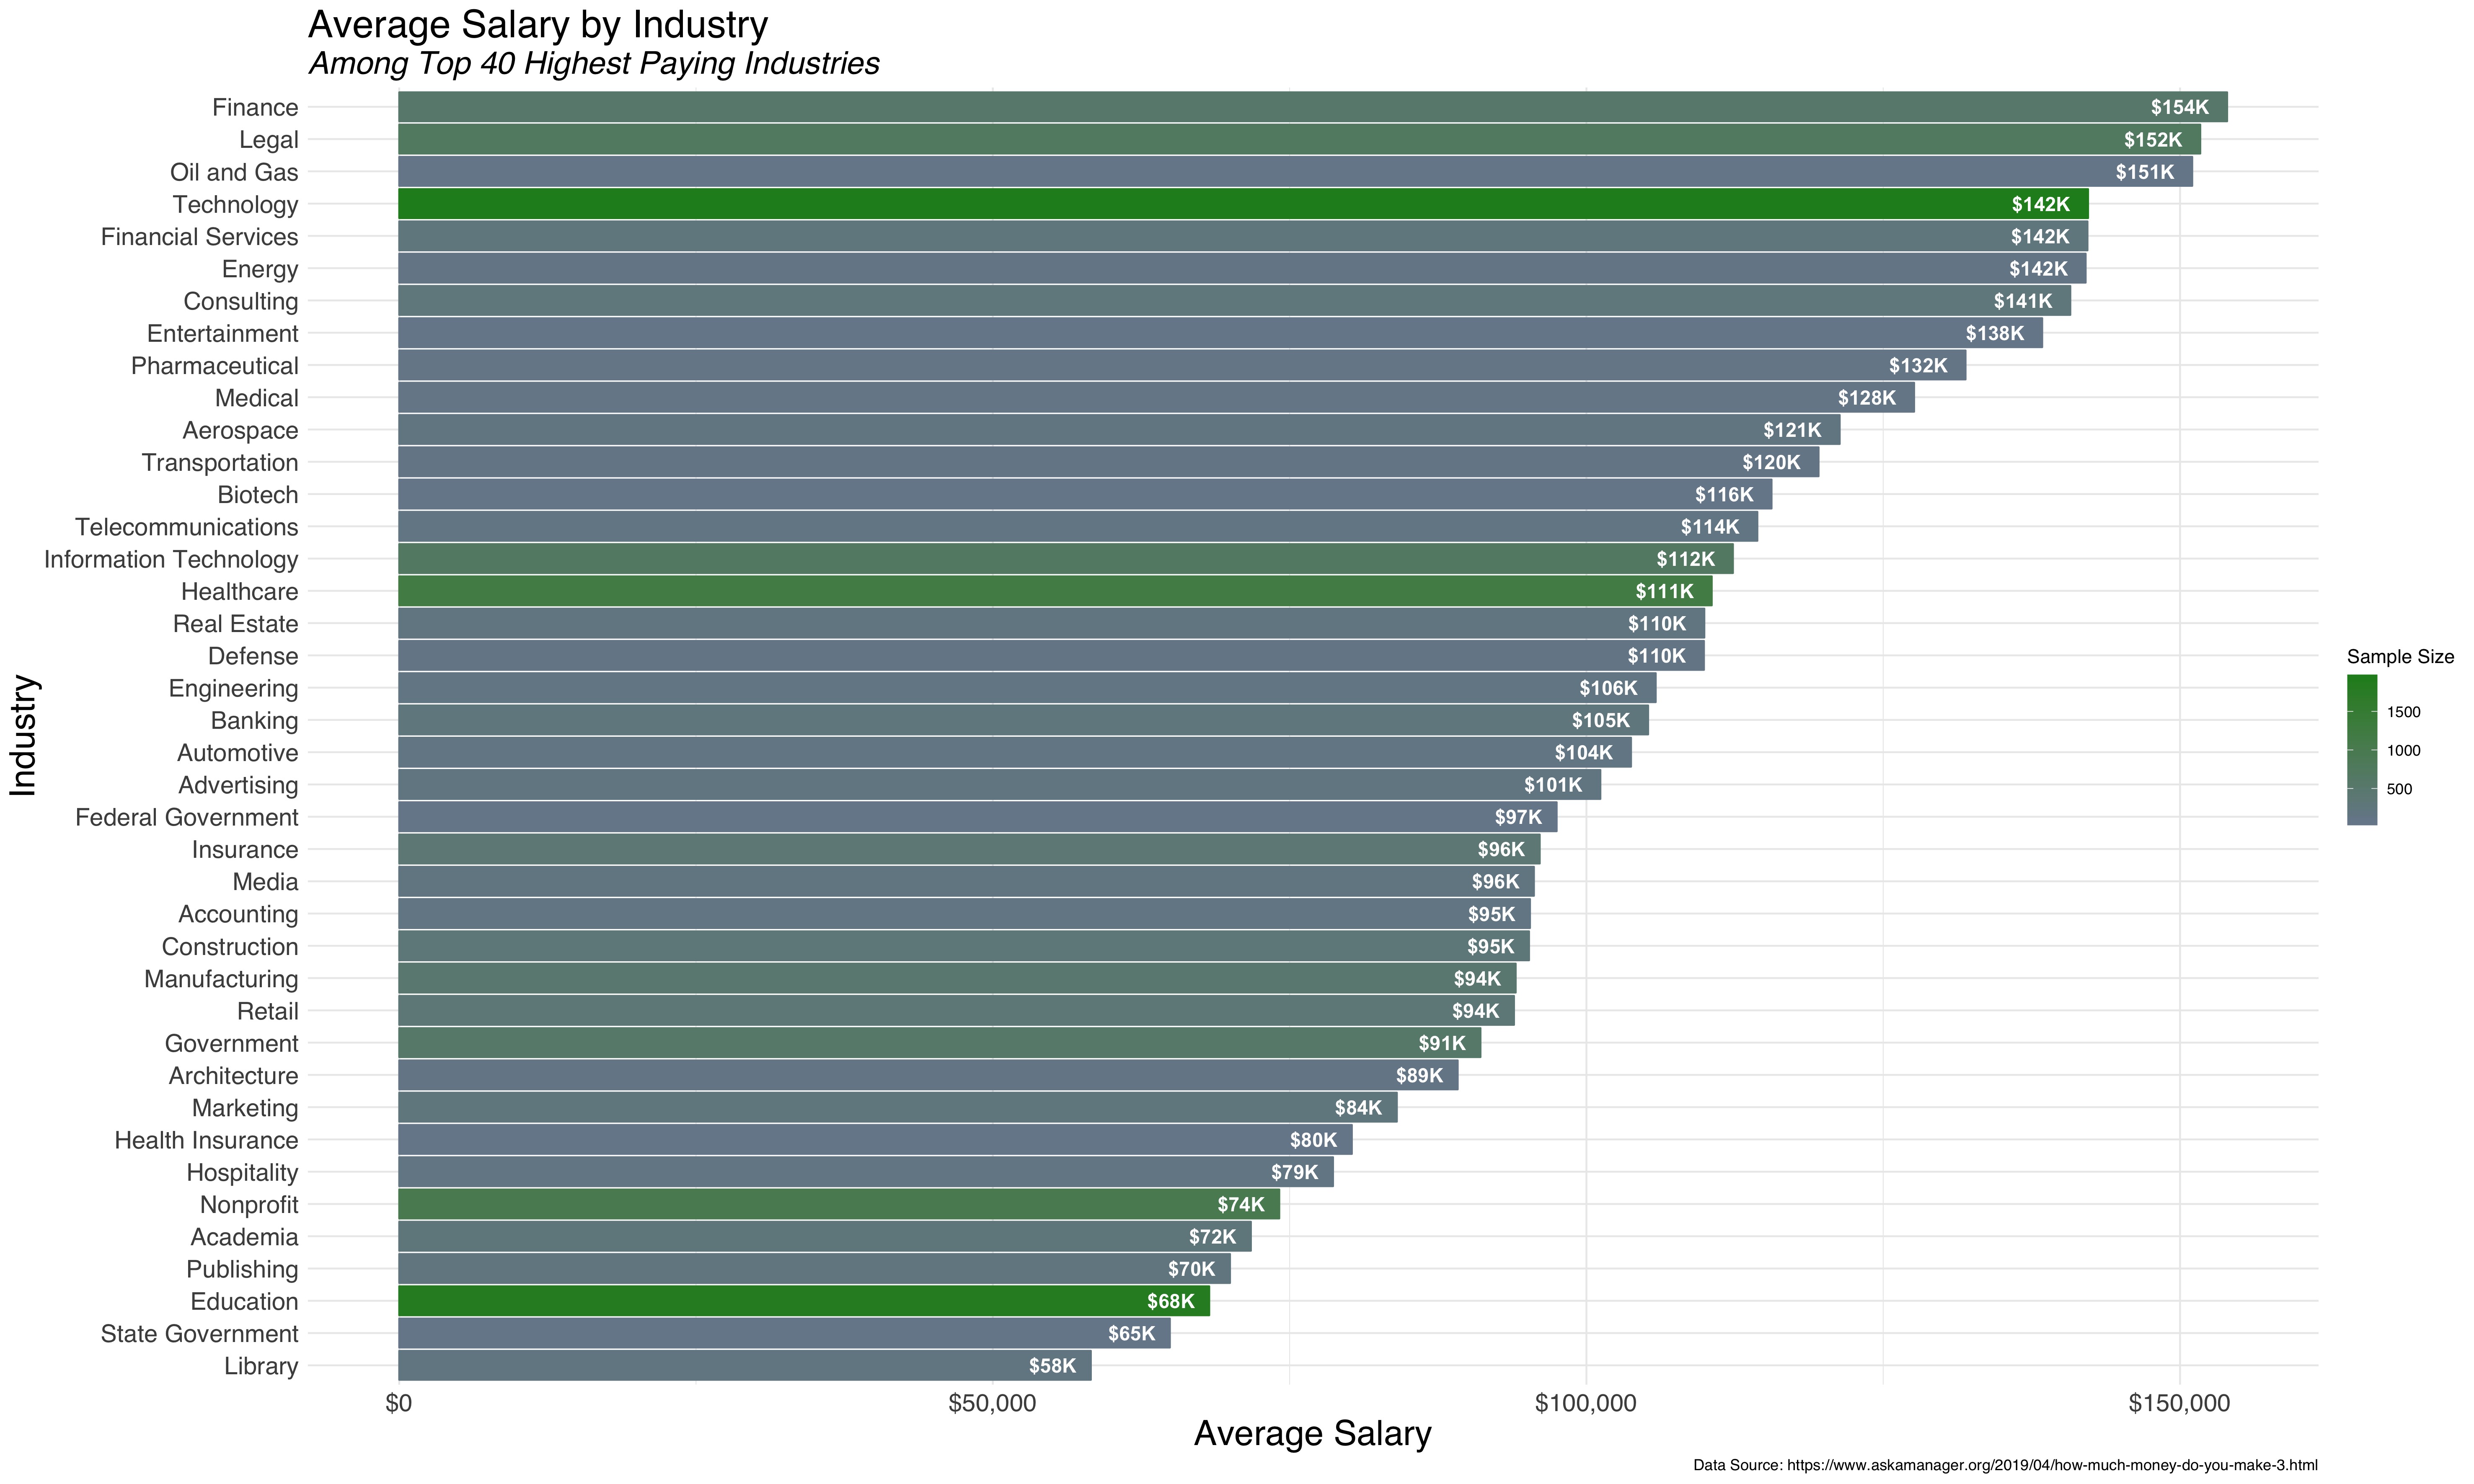
We can see here that this data set shows that the Finance is the highest paying industry – recall that it was also among the top 5 industries for those between the ages of 18-34. Legal, Oil & Gas, Technology, and Financial Services are among the highest, while Academia, Publishing, Education, State Government, and Library towards the bottom. This is still within the top 40 paying industries, so while they may be towards the bottom of this plot, that does not say that they are the lower paying among all industries.
What Are the Most Lucrative Industries Across Age Groups?

More cool stuff to see here, the biggest thing that stood out to me was that Medicine isn’t in the top 10 for ages 18-24 year olds, but consistently in the top 5 for all other ages – this totally makes sense because med school is no short task!
Which Industries Have the Biggest Range of Salaries?
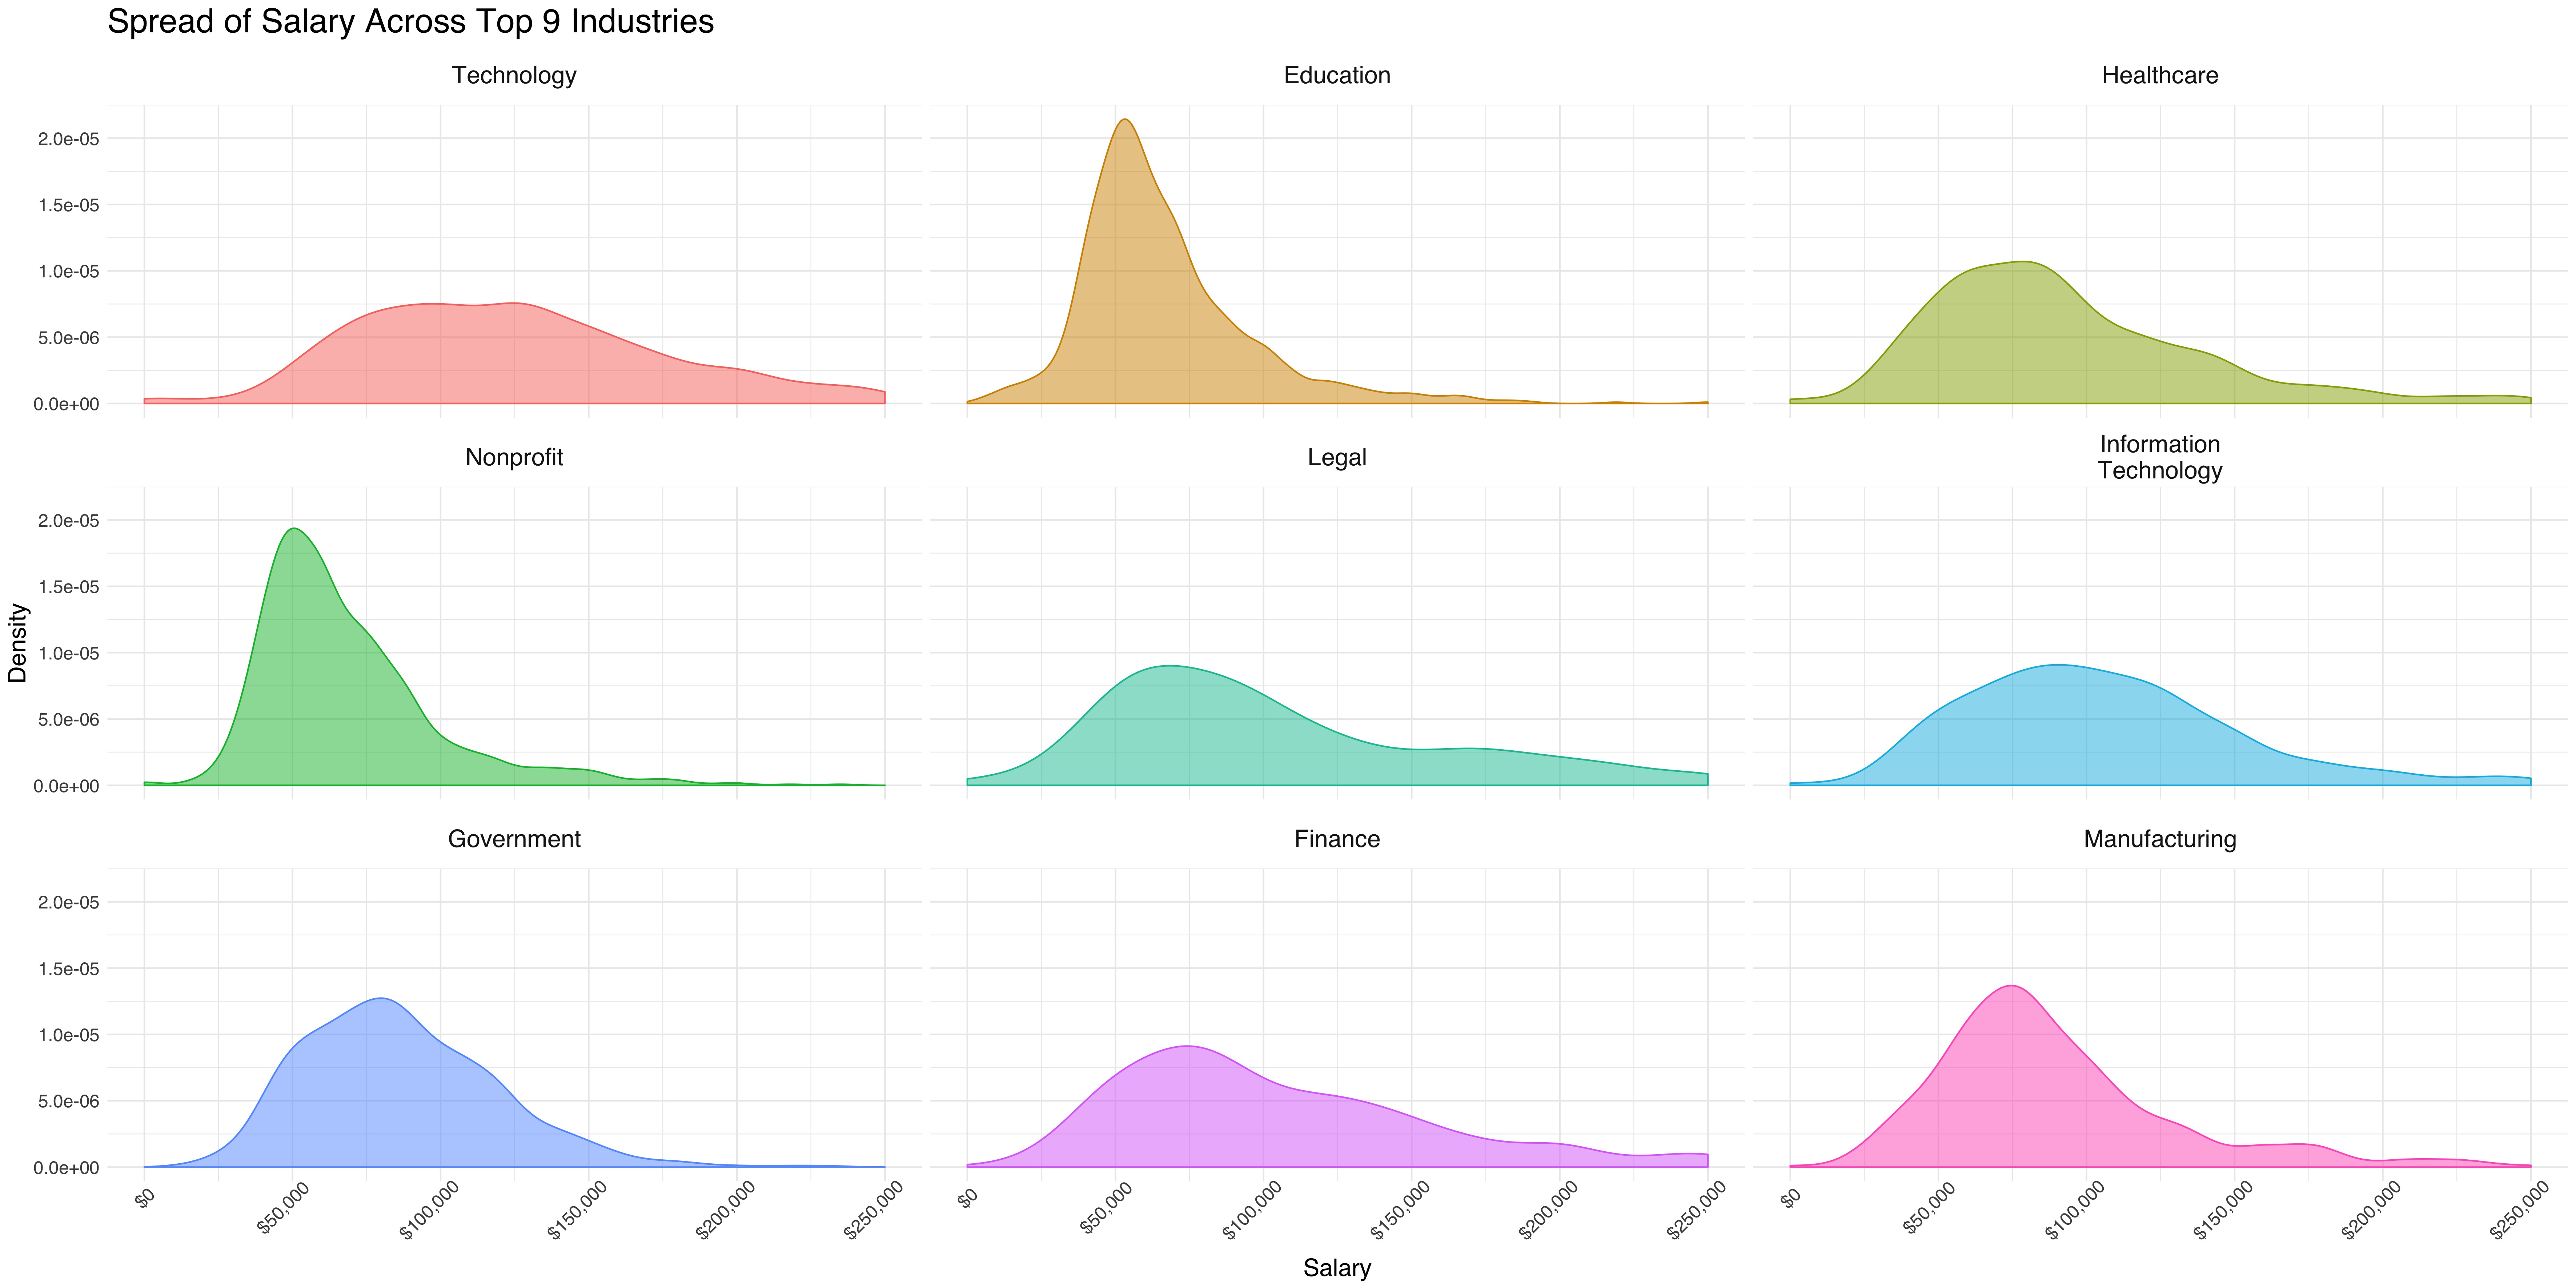
So, here I was interested in seeing, in which industries, do salaries vary a lot, and in which industries, do they seem to peak and stay at a certain place? I’m looking at the top 9 most common industries which show up in this dataset – ordered from left to right and top to bottom.
By looking at the density curves, we can see that in industries like Technology, IT, and Healthcare, there is a large spread of salaries. While, in industries like Education and Nonprofit, there seems to be a peak – meaning the large majority of folks in the industry are making that salary and there is less of a spread.
Which Industries Have the Highest Composition of 18-34 year olds?
Okay, this next question I was interested was basically, if I walk into an office, and I look around, in which places will I see the highest percentage of young people? Of older people? So, what I’m going for here, is asking, of all the people in a specific industry, for which industries, do 18-34 year olds make up the largest proportion of the workforce? This means something a bit different than our first plot, which was asking, of all the working 18-34 year olds, which industries are the most of them going to? So, while Technology, was the most common industry for 18-34 year olds, it might not have the highest composition of 18-34 year olds, if there are also a lot of folks 35+ in technology. So where are millennials working way more than millennials?

Okay lots of stuff going on here!! A couple things I see:
- Fintech is the industry which has the largest portion of 18-34 year olds at about 19%. This also tells us that no industries in this data set have 18-34 year olds composing of more than 20% of their workforce.
- Book Publishing has the highest composition of 25-34 year olds. We can also see that the bars for 25-34 year olds are huge compared to the others! This tells us that in a bunch of industries, the majority of the workforce is between those ages.
- Design is composed almost entirely of 35-44 year olds (43.8%) and 25-34 year olds (50%).
- CPG has a relatively equal composition of 25-34 year olds (35.7%), 35-44 year olds (28.6%), and 45-54 year olds (28.6%).
- 77% of those in the Journalism industry are under the age of 34.
- Restaurant industry, has the highest composition of 65+, but only at 5%. It is also second highest for those 18-24.
Overall… A LOT more to learn
This dataset was a ton of fun to dive into to and organized nicely enough that there wasn’t a ton of up front work before I got into some really interesting stuff. Plus, there’s a bunch of stuff I haven’t even looked at yet, things like
- Which industries are most popular in certain cities?
- Do certain industries have more people with higher experience levels?
- Are there industries where there is less of a correlation between experience and salary?
- How do job titles vary across ages?
Anyways, thanks for reading and thanks to askamanger.org for the fun dataset!

